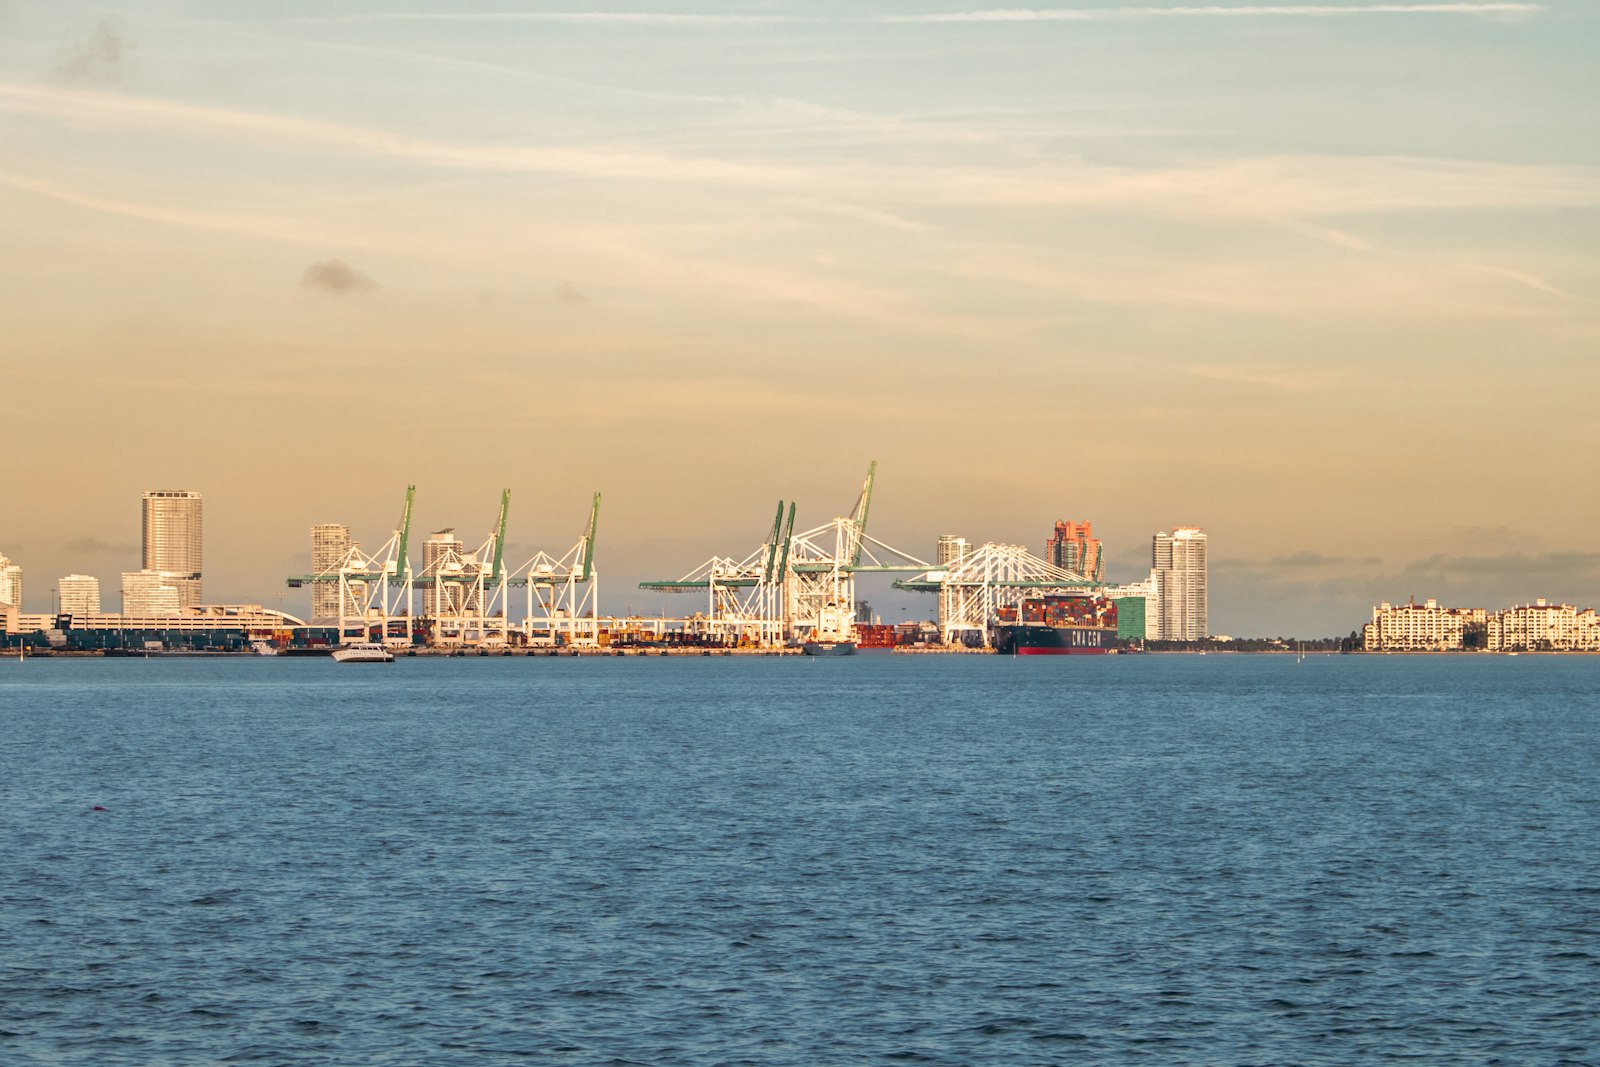
Container cranes at PortMiami on Dodge Island. Source: Zoshua Colah, Unsplash License
Quick Answer: Demand came back to Miami-Dade industrial space in the third quarter of 2026. CBRE counted 1.27 million square feet of net absorption and Cushman & Wakefield about 1.4 million. Brokers disagree on vacancy (5.6% to 7.7%) and rents because they measure different buildings, but they agree that big tenants are moving in, the construction pipeline has shrunk sharply and sublease space remains the soft spot.
Miami-Dade’s warehouse market has had a long cool-down. Record deliveries in 2024 were followed by negative net absorption in 2025 and a surge of sublease listings. The third-quarter 2026 reports, released in October, now show tenants absorbing space again. They also show developers starting far fewer buildings. Below, the main broker reports are compared side by side and checked against airport, seaport and federal jobs data.
What happened in Miami-Dade industrial real estate in Q3 2026?
Did tenants absorb more space than they gave back?
Yes, and every firm says so. CBRE’s Q3 2026 Miami Industrial Figures report, dated October 7, 2026, puts net absorption at 1.27 million square feet. Year to date, CBRE counts 2.63 million. Cushman & Wakefield’s MarketBeat, published October 20, counted about 1.4 million square feet for the quarter and 1.78 million year to date. Savills reported 2.5 million square feet absorbed year to date. Matthews puts third-quarter absorption at 2.44 million square feet, up from 859,000 a year earlier.
That is a turnaround. Marcus & Millichap’s second-quarter 2026 report says Miami posted negative net absorption for a second straight year in 2025 and roughly 1 million square feet of move-outs in early 2026.
Which leases drove the rebound?
One building did much of the work. PepsiCo signed a 794,230-square-foot lease at Bridge Point Commerce Center, which Transwestern recorded in the fourth quarter of 2025. CBRE says the move-in at Bridge Point’s Phase II landed in the third quarter of 2026 and cut North Central Dade vacancy from 9.6% to 6.8%. Cushman & Wakefield says Pepsi occupied about 793,000 square feet in the quarter and Ryder about 409,000.
New deals clustered near the airport and in Medley:
| Tenant | Address / Park | Submarket | Sq. Ft. | Type |
|---|---|---|---|---|
| Walmart | 10900 NW 138th St (Seagis @ Medley) | Medley | 235,812 | New |
| Expeditors International | 10205 NW 19th St, Bldg 6 | Airport West | 206,000 | Renewal |
| SpeedX (Speed Xpress) | 1325 NW 129th Ave (Prologis Beacon Lakes) | Airport West | ~164,000 | New |
| Rhenus Logistics | 11440 NW 122nd St | Airport West | 159,180 | New |
| Perez Trading Company | 12300 NW 32nd Ave (Prologis) | Not specified | 141,000 | Lease |
Source: Cushman & Wakefield Miami Industrial MarketBeat Q3 2026; Lee & Associates South Florida Industrial Q3 2026; CBRE Miami Industrial Figures Q3 2026. Submarket names follow each broker’s own boundaries.
Walmart’s Medley lease shows up in the Cushman & Wakefield, Lee & Associates and CBRE reports. Cushman & Wakefield also counted 10 big-box deals in the quarter and 24 so far this year, up from 18 at this point in 2025. Renewals reached 968,000 square feet in the quarter, 61.1% more than a year earlier. Cushman leaves renewals out of its leasing totals.
Why do CBRE, Cushman & Wakefield, Savills and Matthews report different vacancy rates?
How far apart are the headline numbers?
| Metric (Q3 2026) | CBRE | Cushman & Wakefield | Savills | Matthews |
|---|---|---|---|---|
| Inventory tracked | 236.1M sq. ft. | 183.0M sq. ft. | Not stated in summary | Not stated |
| Vacancy | 6.9% (down 40 bps QoQ) | 5.6% (down 70 bps QoQ) | 7.7% (up 10 bps QoQ) | 7.6% (up 116 bps YoY) |
| Q3 net absorption | 1.27M sq. ft. | ~1.36M sq. ft. | 2.5M YTD | 2.44M sq. ft. |
| Average asking rent | $17.79 (up 7.4% YoY) | $15.16 net (down 8.5% YoY) | $16.18 (down 2.8% QoQ) | $21.21 (up 1.4% YoY) |
| Under construction | 2.87M (11% preleased) | 2.34M (~15% preleased) | “Slowing” | 2.60M |
| Deliveries | 523,000 in Q3 (and YTD) | ~220,000 in Q3; ~1.05M YTD | 3.3M YTD | 1.66M in Q3 |
Source: CBRE Miami Industrial Figures Q3 2026; Cushman & Wakefield Miami Industrial MarketBeat Q3 2026; Savills Miami-Dade Q3 2026 Industrial Market Report; Matthews Miami Industrial Q3 2026.
What explains the gaps?
Mostly, the firms are measuring different sets of buildings. CBRE tracks about 236 million square feet across four product types: distribution and logistics, general manufacturing, R&D/flex, and other industrial. It counts space as vacant if it can be occupied within 30 days. Cushman & Wakefield’s base is roughly 183 million square feet, about 53 million less, and its submarket lines differ from CBRE’s. Matthews does not name a data provider in its online summary. Its $21.21 average rent is several dollars above the other firms’ figures, which most likely reflects a different property mix or rent basis.
Rents add one more complication. CBRE reports average direct asking rates, and its definitions say they blend net and gross quotes. Cushman & Wakefield reports weighted average net rents. CBRE also breaks out rents for newer buildings. Space delivered since 2025 averages $20.25 a square foot, and Class A asks $18.62, up 10.5%. As they lease up, the average shifts even if individual landlords hold rents. Cushman & Wakefield’s outlook makes a similar point. It expects rents to begin trending up as higher asking rents in new projects feed into the average.
Counting deliveries is the hardest comparison of all. Year-to-date totals run from about 523,000 square feet (CBRE) to 3.3 million (Savills), a sixfold gap. Completion timing, size thresholds and flex coverage all differ.
Where do the brokers agree?
All four firms report positive absorption for the quarter and smaller construction pipelines. Their vacancy rates fall within about two percentage points of each other. CBRE and Cushman & Wakefield both show vacancy falling in the quarter. Savills shows a small increase. That is consistent with a market that has passed its supply peak but has not fully absorbed it. CBRE adds a useful detail: excluding buildings delivered since 2025, vacancy is 5.4%, the lowest in at least 18 months. Much of the remaining vacancy sits in newer buildings; CBRE puts Class A vacancy at 11.7%.
Is the Miami-Dade warehouse construction pipeline really shrinking?
How much smaller is it than a year ago?
By CBRE’s own numbers, it is much smaller. Its Q3 2025 report showed 5.04 million square feet under construction. The Q3 2026 report shows 2.87 million, a drop of roughly 43% in a year, and only 11% of that space is preleased. Transwestern called 2025’s 2.8 million square feet of deliveries the lowest annual total since 2016. Matthews puts the pipeline at 0.9% of inventory. Matthews’ figures also show annual deliveries peaked at 6.42 million square feet in 2024.
Where is new space still being built?
Construction is concentrated in a few submarkets. In CBRE’s breakdown, North Central Dade has 1.47 million square feet underway and Airport/Doral has 1.03 million. Cushman & Wakefield, which uses different submarket lines, shows Airport West with about 1.54 million square feet. Named projects include Seagis at Medley Industrial Park and Kurv (Bridge) Doral Buildings 3, 4 and 7. CBRE notes that construction began on three more buildings at Derby Pointe in Miami Gardens. About 1.8 million square feet is scheduled to deliver by the end of 2026, according to Cushman & Wakefield. Those deliveries could lift vacancy again.
How big is Miami’s industrial sublease problem?
Sublease space is the weak point in this market. CBRE counts 3.9 million square feet of sublease space available, 17.6% of all available space. That total has nearly doubled in 18 months, and about half of it is in Class A buildings. Sublease space asks an average $14.40 a square foot, down 9% from a year ago and roughly 19% below direct rents.
Most of the space came from housing-related businesses. In February 2026, Bisnow reported, citing Newmark data, that sublease listings rose nearly 22% between September and December 2025, to 3.4 million square feet, the most since 2009. Furniture, appliance and building-materials firms accounted for most of it. Looking ahead, CBRE expects about 3.4 million square feet of listed space to become available in the fourth quarter, including 808,000 square feet of sublease space. Against that, about 1.9 million square feet of signed leases are scheduled to move in.
What do airport cargo, port volumes and jobs data say about demand?
Is air cargo still growing at MIA?
Yes, and quickly. Miami International Airport’s monthly traffic reports show 2,735,529 tons of freight and mail handled from January through September 2026. That is 10.31% more than in the same period of 2025. September volume was 300,767 tons, up 8.64%. In the first half of the year, international freight rose 11.78% and domestic freight 11.82%. The gains build on a record 2025, when MIA handled nearly 3.5 million tons, up 13.6%. That was its sixth straight record year.
What about PortMiami and local employment?
PortMiami handled 1,115,058 TEUs (twenty-foot equivalent units) in fiscal 2025, up 2.35%. Job growth is slower. Bureau of Labor Statistics data for the Miami-Miami Beach-Kendall metropolitan division show 1,347,800 nonfarm jobs in September 2026 (preliminary, not seasonally adjusted), 0.6% more than a year earlier. Trade, transportation and utilities, the sector most closely tied to warehouse demand, had 325,900 jobs, up 0.7%. Manufacturing had 46,800. Cargo is growing far faster than local payrolls, suggesting warehouse demand is driven more by trade flows than by job growth.
| Demand indicator | Latest reading | Change |
|---|---|---|
| MIA freight and mail, Jan-Sep 2026 | 2,735,529 tons | +10.31% YoY |
| MIA international freight, Jan-Jun 2026 | 1,544,325 tons | +11.78% YoY |
| PortMiami containers, FY2025 | 1,115,058 TEUs | +2.35% |
| Nonfarm jobs, Miami metro division, Sep 2026 (p) | 1,347,800 | +0.6% YoY |
| Trade, transportation and utilities jobs, Sep 2026 (p) | 325,900 | +0.7% YoY |
Source: Miami International Airport monthly traffic reports; PortMiami FY2025 cargo announcement; U.S. Bureau of Labor Statistics, Economy at a Glance. (p) = preliminary.
What are Miami-Dade industrial buildings selling for?
Which sales stood out?
The largest verified deal was reported in September, when Commercial Observer said Ares Management paid $108.7 million for two fully leased warehouses from BGRE, the firm formerly called Brookfield Properties. The first is 3811 West 108th Street in Hialeah, a 230,147-square-foot distribution center leased to Target, which sold for $65.3 million. The second is 13190 Northwest 17th Street near Sweetwater, a 142,472-square-foot building leased to LaserShip, which sold for $43.4 million. Cushman & Wakefield also listed these third-quarter trades:
- 11900-11990 SW 128th Street in South Dade, sold by Sol and Joann Brown to JPMorgan Chase for $38.5 million.
- 2100 NW 88th Court in Airport West, about 115,000 square feet, sold by Creative Beauty Group to Jet Engine Technology Corporation for $29.5 million (about $257 a square foot).
- 7600 NW 26th Street, 88,815 square feet, sold by Terreno Realty to Dalfen Industrial for $21.5 million (about $240 a square foot).
What do pricing benchmarks show?
Matthews counts $1.50 billion of Miami industrial sales in the third quarter and $2.8 billion over the trailing 12 months, down 4% from the year before and below the 2022 peak of $3.4 billion. It puts average pricing at a record $284 a square foot and the average cap rate at 5.53%, 45 basis points above the third-quarter 2022 low. Lee & Associates reports $268 a square foot for South Florida as a whole, but with a 7.12% cap rate. The gap likely reflects Lee’s three-county geography and a different deal sample.
What should tenants and owners watch going into 2027?
- Fourth-quarter move-ins compared with new listings. CBRE’s 1.9 million square feet of scheduled move-ins against 3.4 million square feet coming available shows how quickly vacancy could rise again.
- Big-block supply. CBRE counts 26 new leases or expansions of 100,000 square feet or more over the past year, against 38 available blocks that size.
- How deep sublease discounts go. Sublease space asking about 19% below direct rents limits how far landlords can push direct rents in comparable buildings.
- Infill tightness. Cushman & Wakefield shows Airport East/Downtown at 3.6% vacancy and Hialeah at 2.8%.
Marcus & Millichap’s mid-year report cautioned that tariff and energy volatility could stall leasing.
This article is news and analysis for general information. It is not legal, tax or investment advice.
Frequently Asked Questions
What is the Miami-Dade industrial vacancy rate in Q3 2026?
It depends on the broker. CBRE reports 6.9%, Cushman & Wakefield 5.6%, Savills 7.7% and Matthews 7.6%. The firms track different sets of buildings, so compare each firm’s trend over time rather than mixing their numbers.
How much industrial space is under construction in Miami-Dade?
Between about 2.3 million and 2.9 million square feet, depending on the source. CBRE reports 2.87 million square feet, down from 5.04 million a year earlier, and only 11% is preleased.
Which submarkets are tightest?
Cushman & Wakefield shows Northeast Dade at 1.4%, Hialeah at 2.8% and Airport East/Downtown at 3.6%. CBRE shows Kendall/Tamiami at 2.6%. Miami Lakes is among the loosest in both reports, at 9.1% to 9.6%.
Why does air cargo matter for Miami warehouses?
MIA moved 10.31% more freight and mail in the first nine months of 2026 than a year earlier. Forwarders and importers need space near the airport, which keeps Airport West, Doral and Medley among the busiest leasing submarkets.
Sources and Further Reading
- Miami Industrial Figures Q3 2026, CBRE
- Miami Industrial Figures Q3 2025, CBRE
- Miami Industrial MarketBeat Q3 2026, Cushman & Wakefield
- Miami-Dade Q3 2026 Industrial Market Report, Savills
- Miami Industrial Q3 2026, Matthews
- South Florida Industrial Q3 2026, Lee & Associates
- Miami Industrial Q4 2025 Market Report, Transwestern
- Miami-Dade 2Q26 Industrial Market Report, Marcus & Millichap
- Housing Industry Tenants Drive Spike in Miami Industrial Sublease Supply, Bisnow
- Ares Buys Two Fully Leased Miami Warehouses for $109M, Commercial Observer
- Monthly Calendar Year Traffic Reports, June and September 2026, Miami International Airport (Miami-Dade Aviation Department)
- MIA Soars to Sixth Straight Record Year in Cargo Growth, Airport Improvement
- PortMiami Surpasses One Million TEUs Handled During Fiscal Year 2025, International Association of Ports and Harbors (World Ports)
- Economy at a Glance: Miami-Miami Beach-Kendall, FL Metropolitan Division, U.S. Bureau of Labor Statistics
About the Author