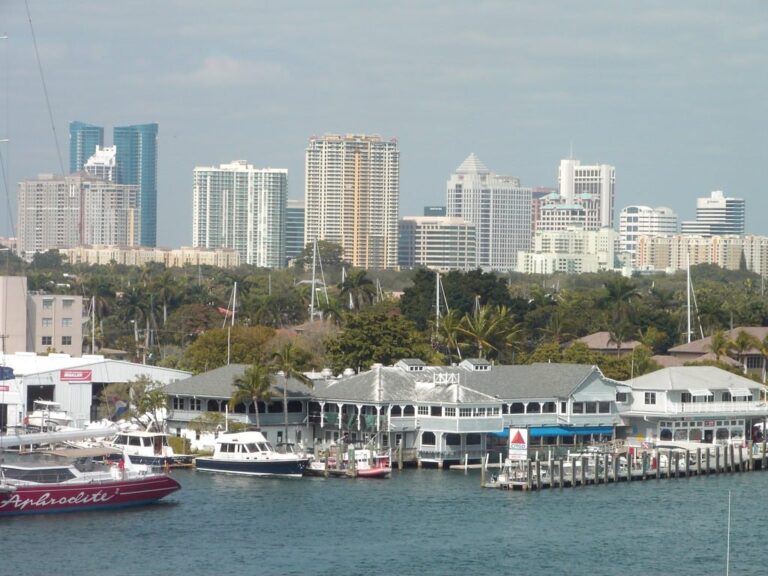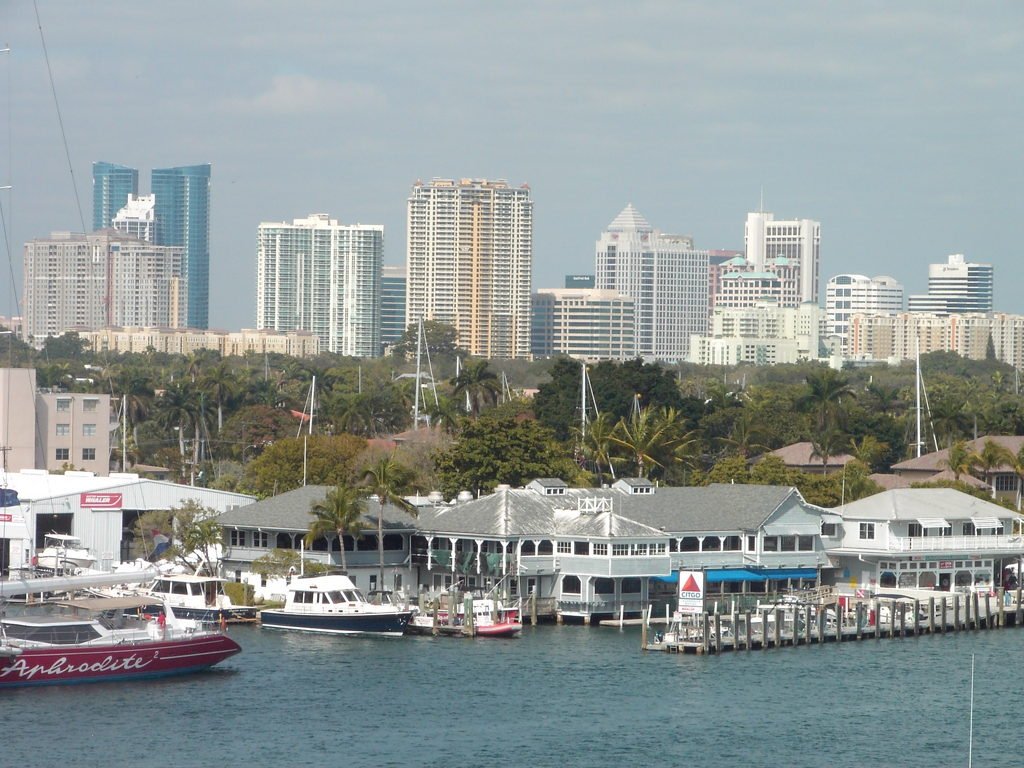
Downtown Fort Lauderdale skyline from the 17th Street Bridge over the Intracoastal Waterway. Source: Rstepp via Wikimedia Commons. License: Public domain.
Quick Answer: Broward County’s office market posted positive net absorption in the third quarter of 2026, with CBRE counting about 66,000 square feet and Cushman & Wakefield nearly 84,000 square feet. Vacancy stayed high: 18.8% in CBRE’s survey and 16.5% in Cushman & Wakefield’s, a gap explained largely by different building inventories. Asking rents rose 7% to 8% year over year, while the only project under construction, T3 FAT Village East in downtown Fort Lauderdale, is due to deliver by year-end.
Broward County’s office market turned in its best quarter of the year from July through September 2026. Brokerage research released in October shows tenants absorbing space across the suburbs, rents still climbing, and a construction pipeline down to a single building. The headline numbers vary by firm, and downtown Fort Lauderdale lost occupancy even as its leasing hit a multi-year high. This report compares CBRE and Cushman & Wakefield figures with Q2 2026 and Q3 2025 and explains why their vacancy rates differ. All figures are as of the end of the third quarter of 2026 unless stated otherwise.
What is the Broward County office vacancy rate in Q3 2026?
The answer depends on which brokerage you ask. CBRE’s Fort Lauderdale Office Figures report for Q3 2026, published October 5, 2026, puts total vacancy at 18.8% across a 24.35 million-square-foot inventory. Total availability, which counts space that is marketed for lease but may still be occupied, was 23.1%, made up of 19.9% direct availability and 3.2% sublease availability. CBRE describes vacancy as stable year over year, and availability improved 80 basis points.
Cushman & Wakefield’s Broward Office MarketBeat for Q3 2026 reports overall vacancy of 16.5% across 26.4 million square feet. That is down 30 basis points from the prior quarter, which the firm calls “the first decline after three consecutive quarterly increases,” but still 30 basis points higher than a year earlier. Working back from those changes, Cushman & Wakefield’s vacancy stood at roughly 16.8% in Q2 2026 and 16.2% in Q3 2025.
| Q3 2026 metric | CBRE | Cushman & Wakefield |
|---|---|---|
| Inventory tracked | 24.35M sq. ft. | 26.40M sq. ft. |
| Overall vacancy | 18.8% | 16.5% |
| Class A vacancy | 19.4% | 18.3% |
| Class B vacancy | 17.9% | 14.0% |
| Q3 net absorption | +66,000 sq. ft. | +83,904 sq. ft. |
| Year-to-date net absorption | -7,000 sq. ft. | -48,475 sq. ft. |
| Q3 leasing volume | 500,000 sq. ft. | 392,000 sq. ft. |
| Average asking rent | $29.35 (direct), +8.3% YoY | $45.59 (full service), +7.1% YoY |
| Under construction | 177,000 sq. ft. | 174,790 sq. ft. |
Source: CBRE; Cushman & Wakefield.
Why do CBRE and Cushman & Wakefield report different numbers?
The firms measure different buildings and quote rents on different bases.
How does each firm define the office inventory?
CBRE’s survey covers competitive Class A and Class B office buildings of 30,000 square feet or more in Broward County. It excludes government and medical buildings, and since Q1 2022 it has included single-tenant buildings that are not owner-occupied. Cushman & Wakefield tracks about 2 million more square feet, 26.4 million versus 24.35 million, split into 15.4 million square feet of Class A and 11.0 million of Class B. Most of that extra space is Class B, where Cushman & Wakefield counts about 11.0 million square feet compared with roughly 9.45 million in CBRE’s class tables. A larger pool of well-leased older buildings pulls vacancy down, which fits the biggest gap between the surveys: Class B vacancy of 14.0% at Cushman & Wakefield against 17.9% at CBRE.
Why are the rent figures so far apart?
Cushman & Wakefield publishes full-service asking rents, which bundle operating expenses, taxes and insurance into the quoted rate. CBRE reports average direct asking rents, and its Q2 2026 Fort Lauderdale report labels them on a triple-net basis, meaning tenants pay those building costs on top of the base rent. That accounts for most of the roughly $16 gap between CBRE’s $29.35 and Cushman & Wakefield’s $45.59. The two firms also draw submarket lines differently. Both list the same 24,921-square-foot Venture X lease at 13450 W. Sunrise Blvd., but CBRE places it in Sawgrass Park while Cushman & Wakefield files it under Sunrise, within its West Broward grouping.
What does a regional CoStar-based number add?
Lee & Associates’ Q3 2026 South Florida office report, which cites CoStar data, shows how much the definition matters. It puts vacancy at 8.2% across a 254.6 million-square-foot tri-county inventory that includes far more buildings than either brokerage survey. That rate is down from 8.4% in Q2 2026 and 8.5% in Q3 2025, with an average triple-net asking rent of $41.90 per square foot. It is not a Broward figure, but it shows how far broad-database vacancy rates run below surveys of competitive buildings.
How much office space did Broward tenants absorb in Q3 2026?
Both firms recorded the strongest quarterly absorption of 2026. CBRE counted 66,000 square feet of positive net absorption, up from 28,000 square feet in Q2 2026 and 10,000 square feet in Q3 2025. Class B accounted for 45,000 square feet, a reversal from negative 24,000 square feet a year earlier, while Class A added 21,000 square feet. Through three quarters, CBRE’s year-to-date absorption was a small negative 7,000 square feet.
Cushman & Wakefield recorded 83,904 square feet of positive absorption, its first gain after four quarters of declines, leaving the year-to-date total at negative 48,475 square feet. Suburban Broward absorbed about 104,000 square feet, the best suburban quarter since Q2 2024, while the Fort Lauderdale CBD gave back space. The firm named Fanatics (20,749 square feet) and State Farm (16,699 square feet) as notable suburban move-ins, and BDO’s move-out in the CBD was the largest of the quarter.
Is leasing activity rising or falling?
Here the firms diverge again. Cushman & Wakefield reports 392,000 square feet of new leasing in Q3 2026, a two-year quarterly high, and more than 1.05 million square feet year to date, up 7.2% from 2025. It excludes renewals from leasing totals. CBRE reports 500,000 square feet of leasing, down 15.7% from 593,000 square feet in Q2 2026 and down 19.4% from 620,000 square feet in Q3 2025. Because one firm excludes renewals and the other’s report does not say, the two leasing totals are not directly comparable.
How do Class A and Class B asking rents compare?
Rents kept rising in both classes. In Cushman & Wakefield’s full-service figures, Class A averaged $50.49 per square foot, up 7.5% year over year, and Class B averaged $36.67, up 5.5%. Class A space in the CBD reached $65.98, up 10.1%, and the Las Olas corridor averaged $80.90. In CBRE’s direct asking rents, the overall average was $29.35, up 8.3% year over year and up from $28.88 in Q2 2026, while Class A averaged $32.03, up 5.9%. CBRE’s suburban Class B average was $23.38, and Cypress Creek posted the lowest Class B rent in the county at $18.76.
Rents and vacancy are moving in different directions. Class A vacancy rose 70 basis points from a year earlier in Cushman & Wakefield’s count, yet Class A rents rose faster than Class B. The premium for top-tier buildings has widened even as more Class A space sits empty.
Which Broward office submarkets are strongest and weakest?
CBRE’s submarket table shows a market split between tight suburban hubs and areas with a quarter of their space empty.
| Submarket | Inventory (sq. ft.) | Vacancy | Sublease avail. | Q3 net absorption | Avg. asking rent |
|---|---|---|---|---|---|
| Plantation | 3.47M | 13.2% | 4.8% | -9,000 | $27.41 |
| Cypress Creek | 5.48M | 15.3% | 1.8% | +28,000 | $22.61 |
| Northeast Broward | 1.36M | 15.5% | 2.0% | +35,000 | $23.21 |
| Northwest Broward | 844,000 | 17.0% | 1.7% | +14,000 | $26.27 |
| Fort Lauderdale CBD | 4.85M | 18.8% | 3.2% | -67,000 | $44.34 |
| Southeast Broward | 2.53M | 21.0% | 1.6% | +19,000 | $32.19 |
| Southwest Broward | 2.88M | 24.5% | 4.8% | +36,000 | $25.37 |
| Sawgrass Park | 2.93M | 26.5% | 4.5% | +9,000 | $23.23 |
Source: CBRE (direct asking rents, per sq. ft. per year).
How is downtown Fort Lauderdale performing?
The CBD had the busiest leasing in CBRE’s count, with 161,000 square feet, but it also had the largest occupancy loss, negative 67,000 square feet. Cushman & Wakefield recorded a smaller loss of 19,755 square feet and put CBD vacancy at 16.6%, up 50 basis points from a year earlier and near a two-year high. Downtown leasing is up 44.2% year to date to 270,000 square feet, the highest year-to-date total since 2022. GXO Logistics’ 35,000-square-foot new lease at 501 N. Andrews Ave., the T3 FAT Village East building, was the quarter’s largest downtown deal in both reports.
What is happening in Cypress Creek, Plantation and Sawgrass?
Plantation had the lowest vacancy among CBRE’s submarkets at 13.2%, although its 4.8% sublease availability is tied for the highest. Cushman & Wakefield also shows Plantation tight at 13.7%, with 24,617 square feet of positive absorption. Cypress Creek, the county’s largest suburban office hub at 5.48 million square feet in CBRE’s count, absorbed 28,000 square feet and leased 116,000 square feet. CBRE’s Cypress Creek deals included a 22,000-square-foot USI Insurance renewal at 2400 E. Commercial Blvd., an 18,000-square-foot new lease by West Marine at 2001 NW 64th St. and a 16,000-square-foot Central Reach renewal. Sawgrass Park remains the softest area at 26.5% vacancy, even though it produced the quarter’s largest lease: Health Care Financial Services (HCFS) took 36,000 square feet at 1643 NW 136th Ave. Cushman & Wakefield shows 24.0% vacancy in Sunrise and 23.4% in Weston.
Is sublease space growing in Broward?
Yes, on CBRE’s measure. Sublease availability rose to 3.2% of inventory in Q3 2026 from 2.5% in CBRE’s Q2 2026 report, even as total availability held near 23%. Plantation and Southwest Broward each carry 4.8% sublease availability. Cushman & Wakefield reports 213,407 square feet of vacant sublet space countywide.
What office construction is underway in Broward County?
One building. T3 FAT Village East, at 501 N. Andrews Ave. in downtown Fort Lauderdale, totals about 176,500 square feet in CBRE’s records and 174,790 square feet in Cushman & Wakefield’s. CBRE reports it 27.0% pre-leased, with its first pre-leasing announced in Q3, and expects delivery in Q4 2026. Cushman & Wakefield says it was more than 76% vacant at the time of its report. No office space was delivered in Q3. Cushman & Wakefield also flags the former Spirit Airlines headquarters, which could return to the market with more than 250,000 square feet, and expects vacancy to trend upward into 2027 as that space and the FAT Village building come online.
What were the notable Broward office sales in Q3 2026?
Three sales stood out in Cushman & Wakefield’s report. The largest was 110 SE 6th St. in the CBD, a 394,830-square-foot Class A tower that sold for $89.0 million, about $225 per square foot, from IP Capital Partners to Mana Group. Memorial Healthcare System bought the 258,737-square-foot Venture Center Portfolio in Hollywood/Hallandale from Fox Ridge Capital for $69.0 million, or $267 per square foot. The Community Foundation of Broward acquired 200 N. Andrews Ave., a 23,656-square-foot building, from Bell Curtis for $5.7 million, or $243 per square foot.
| Property | Submarket | Buyer | Size (sq. ft.) | Price | Per sq. ft. |
|---|---|---|---|---|---|
| 110 SE 6th St. | CBD | Mana Group | 394,830 | $89.0M | $225 |
| Venture Center Portfolio | Hollywood/Hallandale | Memorial Healthcare System | 258,737 | $69.0M | $267 |
| 200 N. Andrews Ave. | CBD | Community Foundation of Broward | 23,656 | $5.7M | $243 |
Source: Cushman & Wakefield.
Two of the three buyers are a hospital system and a community foundation rather than conventional office investors. Cushman & Wakefield’s report also lists Broward employment at 918,000 and the county’s unemployment rate at 4.5%, above the national 4.2%.
Brian’s Take
The big story is not whether Broward’s office vacancy is 16.5% or 18.8%. Both brokers agree on direction: a modest gain in occupancy after a weak first half, rents up 7% to 8%, and almost nothing new being built.
What catches my eye is the gap between downtown leasing and downtown occupancy. Leasing in the CBD is at its best year-to-date pace since 2022 and Class A rents there are up 10%, yet the CBD still lost occupancy in Q3. Add a 175,000-square-foot building that was still mostly unleased at the time of Cushman & Wakefield’s report, plus a former airline headquarters of more than 250,000 square feet that could come back to market, and downtown has more space to fill than the rent figures alone suggest.
For business owners deciding where to locate, the practical point is that the market is not one market. Sawgrass Park at 26.5% vacancy and Plantation at 13.2% offer very different negotiating positions, and rising sublease space in the west gives tenants more options. The $225-per-square-foot sale of a Class A downtown tower also shows buyers are pricing in that uncertainty.
Frequently Asked Questions
What is the Fort Lauderdale office vacancy rate?
As of Q3 2026, CBRE reports 18.8% vacancy across Broward County’s competitive office inventory, and Cushman & Wakefield reports 16.5%. Downtown Fort Lauderdale’s CBD vacancy was 18.8% in CBRE’s count and 16.6% in Cushman & Wakefield’s.
How much is office rent in Broward County?
Cushman & Wakefield’s Q3 2026 full-service average was $45.59 per square foot per year, with Class A at $50.49 and Class B at $36.67. CBRE’s average direct asking rent, which excludes operating costs, was $29.35.
Why do brokerage vacancy rates for Broward differ?
Each firm tracks a different set of buildings. CBRE counts competitive Class A and B buildings of 30,000 square feet or more, excluding government and medical buildings, totaling 24.35 million square feet. Cushman & Wakefield tracks 26.4 million square feet, including more Class B space.
Is new office space being built in Fort Lauderdale?
Only one project is under construction countywide: T3 FAT Village East at 501 N. Andrews Ave., about 175,000 square feet, expected to deliver in Q4 2026.
Which Broward submarket has the lowest office vacancy?
Among CBRE’s eight submarkets, Plantation had the lowest vacancy at 13.2% in Q3 2026, followed by Cypress Creek at 15.3%. Sawgrass Park was highest at 26.5%.
Sources and Further Reading
- Fort Lauderdale Office Figures Q3 2026 — CBRE
- Fort Lauderdale Office Figures Q2 2026 — CBRE
- Broward Office MarketBeat Q3 2026 — Cushman & Wakefield
- 2026 Q3 South Florida Office Market Report — Lee & Associates
About the Author