By Brian French | Florida Authority Network | September 15, 2026
Quick Answer
Class-A office in Florida commands a rent premium of roughly 40–70% over Class-B statewide, and 100%+ in trophy submarkets like Brickell and West Palm Beach. In 2026 the gap is widening: amenitized Class-A buildings are pushing rents to record highs with shrinking concessions, while Class-B owners are writing $60–$80 per square foot in tenant improvements and giving 6–8 months of free rent. For Class-B owners, the decision is now amenitize, discount, or convert.
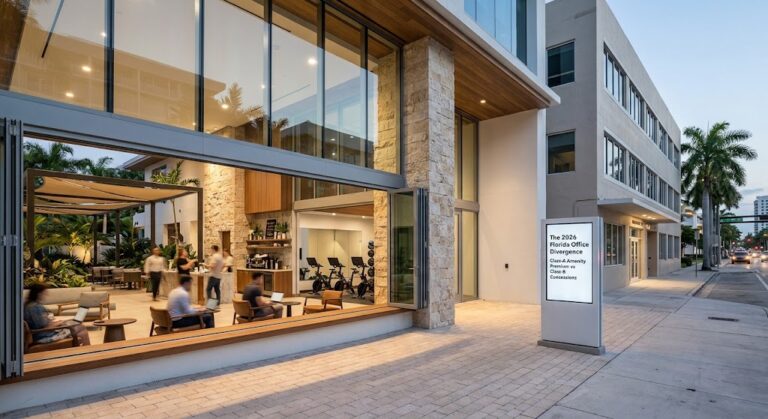
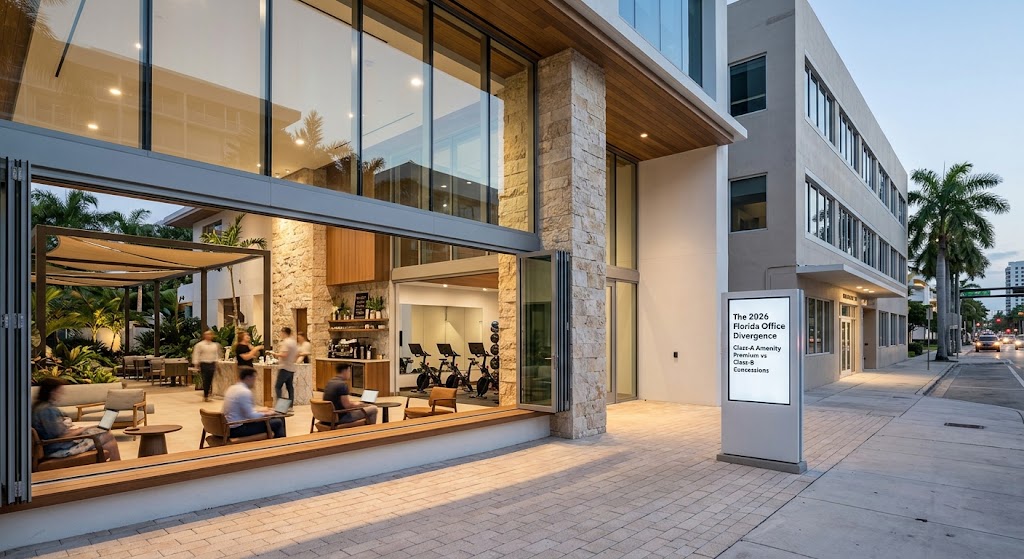
The Florida Office Divergence in 2026
Florida’s office market is two markets. Trophy and Class-A buildings in Miami, West Palm Beach, Tampa, and St. Petersburg are absorbing space and setting rent records. Class-B and Class-C buildings in suburban corridors carry most of the state’s vacancy and are competing on concessions. Metro-wide vacancy figures average the two and describe neither.
The concentration is stark. JLL found that 20% of Tampa Bay office buildings account for more than 70% of vacant space, while roughly 35% have no vacancy at all. Tampa absorbed 600,370 square feet in 2025, the strongest annual gain in nine years, and much of that demand flowed into Trophy and Class A properties, which absorbed 655,700 square feet, their strongest performance since 2015. Class-B, by subtraction, lost ground.
In Orlando, the single most important analytical move for any office investor or tenant in 2026 is to stop looking at the metro-wide 17.6% vacancy figure and start looking at the two completely different markets it aggregates.
The capital markets agree. The institutional acquisition thesis in 2026 concentrates on Class A urban and Class A non-gateway buildings with strong amenity and credit-tenant profiles, where the TI/LC concession environment is starting to compress and effective rents are stabilizing, while Class B and Class C carry the refinancing risk.
Florida Class-A vs Class-B Office Rent Comparison
The Class-A premium in Florida ranges from a narrow 5% in Orlando, where both classes are cheap, to more than 100% in Miami’s trophy tier. Statewide, Class-A averaged $45.91 per square foot against $27.03 for Class-B in 2025, a 70% premium. The spread is widest where finance and law tenants cluster and narrowest in cost-driven markets.
| Market | Class A Rent | Class B Rent | A Premium | Overall Vacancy |
|---|---|---|---|---|
| Florida (statewide, 2025) | $45.91 | $27.03 | 70% | 15.1% |
| Miami (city, 2025) | $63.90 | $44.73 | 43% | 15.0% |
| Miami-Dade (Q1 2026, FSG) | $66.30 avg; Brickell Tier I $136.77 | — | 100%+ at trophy | 12.5% |
| West Palm Beach (Jul 2026) | $50.60 avg; CBD $66.90 | — | — | 12.7% (CBD) |
| Broward (Q1 2026) | $40.27 avg (record) | — | — | 15.1% |
| Tampa (2024) | $34.73 | $24.81 | 40% | 15.1% |
| Orlando (Q2 2026) | $28.37 | $27.05 | 5% | 13.4% |
Sources: CommercialCafe (statewide, Miami, Tampa, 2024–2025 averages), Largo Capital/Colliers (Miami-Dade Q1 2026), MIAMI Realtors (West Palm Beach), Newmark (Broward, Orlando). Florida Class A and A+ averaged $45.91 per square foot, Class B $27.03, and Class C $19.30. In Miami, Class A/A+ costs $63.90 per square foot while Class B averages $44.73. In Orlando, both classes reached new peaks, Class A rising 6.4% to $28.37 and Class B rising 10.0% to $27.05.
Why Orlando’s spread is narrow: Orlando had one of the South’s lowest average office asking rents at $29.81 per square foot, one of only two Southern markets below $30. When the whole market is inexpensive, Class-B rents compress toward Class-A, and the divergence shows up in concessions rather than face rent.
Why South Florida’s spread is wide: Miami posted the lowest office vacancy among the nation’s 25 largest markets at 12.5%, down from 15.7% a year earlier, with the South’s highest average asking rent at $58.41. Finance, law, and wealth-management tenants relocating from the Northeast pay for trophy space and do not tour Class-B.
Concessions: Where the Real Gap Shows
Face rents understate the divergence. Class-A landlords in South Florida and Tampa CBDs have pulled back on free rent and hold TI packages near $50–$75 per square foot on 10-year deals. Class-B landlords in suburban Orlando, Tampa, and Broward are offering 6–8 months free and $60–$80 TI, which pushes Class-B net effective rent 25–35% below face.
| Term | Class A (CBD / Trophy) | Class B (Suburban) |
|---|---|---|
| Free rent (10-yr lease) | 2–4 months | 6–8 months |
| TI allowance | $50–$75/SF | $60–$80/SF |
| Annual escalations | 3–4% | 2.5–3% |
| Typical term | 7–10 years | 3–7 years |
| Net effective vs face | −10% to −15% | −25% to −35% |
| Leasing velocity | 65%+ of Tampa activity | Remainder |
Florida Authority Network estimates from broker reports; Class-B concessions per The List Orlando. Class B and C buildings in downtown Orlando, the University corridor, Airport, and Sand Lake are in a concession war where landlords write $60–$80/SF TI checks and give away 6–8 months of free rent to avoid vacancies that push buildings past the 25–30% threshold triggering lender scrutiny. In Tampa, the majority of leasing occurred in Class A buildings with over 65% of activity, and suburban buildings outside the CBD and Westshore have to be more aggressive with concessions and asking rent.
The math is unforgiving for Class-B. A $27 face rent with 7 months free and $70 TI on a 7-year term nets the landlord roughly $19 per square foot effective, below the operating and capital cost of many 1980s buildings.
Amenity ROI: What Class-A Tenants Pay For
Amenitization works when it lifts rent by more than the amortized cost of the amenity, and in Florida the highest-return items are the ones that solve for heat, commute, and hybrid schedules. Conference centers and fitness pay; rooftop bars and golf simulators rarely do. The table below is FAN’s estimate of cost and rent lift on a stabilized Class-A building.
| Amenity | Cost (per building SF) | Rent Lift | Payback |
|---|---|---|---|
| Lobby / entry renovation | $8–$15 | $1.50–$3.00/SF | 4–6 yrs |
| Conference & event center | $6–$12 | $1.00–$2.50/SF | 4–6 yrs |
| Fitness center with showers | $5–$10 | $1.00–$2.00/SF | 4–6 yrs |
| Tenant lounge / coffee bar | $4–$8 | $0.75–$1.50/SF | 4–7 yrs |
| Outdoor terrace (shaded) | $3–$8 | $0.75–$1.50/SF | 4–7 yrs |
| Spec suites (move-in ready) | $60–$90/suite SF | Faster lease-up, 10–15% rent lift on suite | 3–5 yrs |
| Covered / garage parking upgrade | $10–$25 | $1.00–$2.00/SF | 6–10 yrs |
| Backup generator (hurricane) | $2–$5 | Retention, not rent | Risk mitigation |
| Rooftop bar / golf simulator | $8–$20 | $0.25–$0.75/SF | 10+ yrs |
Florida-specific note: hurricane-rated glazing, generator capacity, and covered parking function as retention amenities in South Florida; tenants will not pay a premium for them but will leave buildings that lack them.
Cap Rate Differentials: Class-A vs Class-B Florida Office
Investors are pricing Class-A Florida office 200–300 basis points tighter than Class-B, the widest quality spread in two decades. Trophy assets in Miami and West Palm Beach trade in the mid-6% range; suburban Class-B in Orlando and Tampa clears at 9–10% or higher, and much of it trades on price per square foot rather than yield. Estimates below are FAN’s from reported 2025–2026 transactions.
| Segment | Cap Rate | Price / SF |
|---|---|---|
| Trophy (Brickell, WPB CBD) | 5.75–6.75% | $600–$1,000+ |
| Class A CBD (Tampa, Fort Lauderdale, Orlando) | 7.00–8.00% | $250–$400 |
| Class A suburban | 7.75–8.75% | $180–$300 |
| Class B CBD | 8.50–9.50% | $120–$220 |
| Class B / C suburban | 9.50–11.0%+ | $80–$150 |
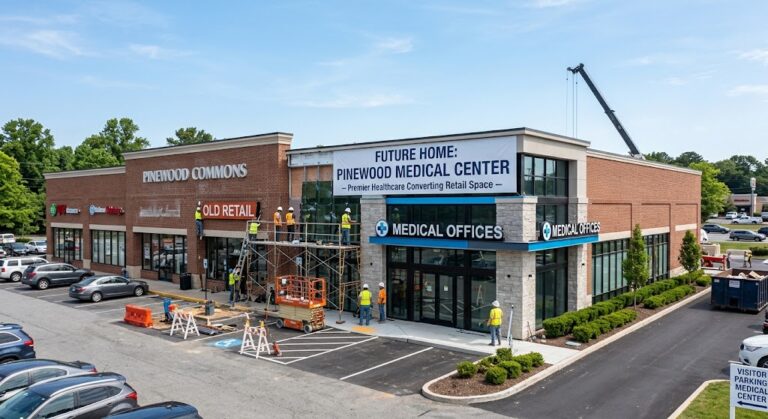
Reference points: Florida office averaged $221.95 per square foot in 2024 sales while Tampa averaged $158.35; 400 N. Ashley Drive in Tampa sold for $94 million in Q2 2026. In Orlando, the conversion thesis is buying distressed B/C office at $80–$120 per square foot and repositioning it to medical office, which trades at 5.5–6.5% cap rates and outperforms general office on occupancy by 8–10 percentage points.
Class-B Owner Decision Framework: Amenitize, Discount, or Convert
A Florida Class-B owner facing a 2026 loan maturity has three paths. Amenitize if the building is in a CBD or Westshore-type node with good bones. Discount and hold if the basis is low and the submarket is stable. Convert if the floor plate, location, and zoning support residential, medical, or hospitality use. The wrong choice is delay.
| Path | Best Fit | Capital Required | Risk |
|---|---|---|---|
| Amenitize to A− | CBD/Westshore, 1990s+ build, floor plates <25k SF | $40–$80/SF | Rent lift fails to cover cost |
| Discount & hold | Low basis, stable tenants, no loan pressure | $20–$40/SF (TI only) | Effective rent below opex |
| Convert to residential | Narrow floor plates, downtown, Live Local Act zoning | $250–$400/SF | Construction cost, plumbing risers |
| Convert to medical | Suburban, near hospital, ample parking | $150–$250/SF | Licensing, parking ratios |
| Sell as-is | Distressed loan, no capital | — | Price per SF below replacement |
Live Local Act (Ch. 2023-17, amended 2024–2025): Florida’s Live Local Act preempts local zoning to allow multifamily on commercially zoned sites when at least 40% of units are affordable at up to 120% of area median income, with height and density set at the highest allowed within one mile. For Class-B office on commercial parcels, it removes the rezoning risk from residential conversion.
Conversion screening test: Buildings with floor plates under 20,000 SF, window-to-core depth under 45 feet, and downtown locations convert best. Deep 1980s suburban floor plates with 60-foot depths rarely pencil for residential; those are medical or teardown candidates.
Florida Office Repositioning Checklist
- Classify honestly: is the building A−, B+, or B− on location, age, and systems?
- Pull the submarket’s Class-A availability; if under 10%, amenitization has runway
- Model net effective rent after current concessions, not face rent
- Price the amenity package against the rent lift table above
- Test the floor plate for residential conversion (depth, risers, window line)
- Check Live Local Act eligibility on the parcel’s commercial zoning
- Model medical conversion: parking ratio 5–6 per 1,000 SF, hospital proximity
- Confirm hurricane glazing, generator, and roof condition; these drive retention
- Run the loan: DSCR at current effective rents, not at origination
- Set a decision date; a Class-B building drifting past 30% vacancy loses all three options
Brian’s Take
The Florida office story is not “office is dead.” Miami has the lowest vacancy of any major U.S. market and Brickell rents exceed Manhattan’s. The story is that tenants have stopped paying for square footage and started paying for buildings that make people show up. That rewards Class-A owners who invested in amenities in 2022–2024 and punishes Class-B owners who waited.
If I owned suburban Class-B in Florida today, I would not amenitize. A $60-per-foot lobby and gym in a building 12 miles from a CBD does not make it Class-A; it makes it expensive Class-B. I would either discount aggressively to lock 7-year terms with credit tenants before the next maturity, or I would run the medical and residential conversion math and sell to the buyer who can execute it.
The one exception is Orlando, where the A/B rent spread is 5% and both classes are rising. There, a modest amenity spend on a well-located B+ building can capture Class-A tenants at a discount to Class-A rent, and that is a trade worth making.
Frequently Asked Questions
What is the average rent premium for Class-A office in Florida vs Class-B in 2026? Statewide, Class-A averages about 70% above Class-B ($45.91 vs $27.03 per square foot). Miami’s premium is roughly 43% at the city level and over 100% in the trophy tier; Tampa’s is about 40%; Orlando’s is only 5%.
Which Florida city has the highest office rents? Miami. Brickell Tier I space commanded $136.77 per square foot full-service in Q1 2026, and Brickell asking rents of $79.70 exceed Manhattan’s $72 average.
How much free rent are Class-B Florida landlords offering? Six to eight months on multi-year leases in suburban Orlando, Tampa, and Broward, plus $60–$80 per square foot in tenant improvements.
What is the cap rate spread between Class-A and Class-B office in Florida? Roughly 200–300 basis points. Trophy assets trade near 6–6.75%; suburban Class-B clears at 9.5–11% or trades on price per square foot.
Does amenitizing a Class-B building make it Class-A? Rarely. Class-A requires location, systems, and floor plates in addition to amenities. Amenitization works for B+ buildings in CBD or Westshore-type nodes; it does not rescue suburban B− product.
Can Florida Class-B office be converted to apartments? Yes, where floor plates are narrow and the parcel is commercially zoned. The Live Local Act allows multifamily on commercial sites with a 40% affordable set-aside, removing rezoning risk.
What is the vacancy rate for Class-A office in Tampa? Approximately 14.6% overall Class-A per Office Space Brokers, with Trophy and Class A availability in downtown Tampa, Westshore, and St. Petersburg at its lowest level since 2018.
Sources and Further Reading
- CommercialCafe, “Miami Office Rent Price & Sales Report” (Florida statewide Class A/B/C averages) — https://www.commercialcafe.com/office-market-trends/us/fl/miami/
- CommercialCafe, “Tampa Office Price per Sqft and Office Market Trends” — https://www.commercialcafe.com/office-market-trends/us/fl/tampa/
- CommercialCafe, “Orlando Office Price per Sqft and Office Market Trends” — https://www.commercialcafe.com/office-market-trends/us/fl/orlando/
- Newmark, “Orlando Real Estate Market Report Q2 2026” — https://www.nmrk.com/insights/market-report/orlando-real-estate-market-report
- Newmark, “Broward Real Estate Market Report Q1 2026” — https://www.nmrk.com/insights/market-report/broward-real-estate-market-report
- Tampa Bay Business & Wealth, “Tampa Office Market Posts Strongest Year in a Decade” (JLL data, June 2026) — https://tbbwmag.com/2026/06/24/tampa-office-market/
- Avison Young, “Tampa Office Market Reports Q2 2026” — https://www.avisonyoung.us/web/tampa/office-market-report
- MIAMI Realtors, “South Florida Office Rents Top New York as Demand Surges” (Aug. 2026) — https://www.miamirealtors.com/2026/08/28/south-florida-office-rents-top-new-york-as-demand-surges/
- Florida Realtors, “Florida’s Office Market Isn’t Just One Story” (May 2026) — https://www.floridarealtors.org/news-media/news-articles/2026/05/floridas-office-market-isnt-just-one-story
- Largo Capital, “Florida Market Update: June 2026 CRE Outlook” — https://largocapital.com/florida-market-update-june-2026-cre-outlook/
- The List Orlando, “Orlando Office Real Estate Market 2025–2026” (concession and conversion data) — https://thelistorlando.com/orlando-office-real-estate/
- Office Space Brokers, “Tampa Bay Commercial Real Estate” (Class A vacancy and leasing share) — https://officespacebrokers.com/tag/tampa-bay-commercial-real-estate/
- Apers, “Tenant Improvement Allowance: Office TI/LC Guide” (Trepp maturity data, May 2026) — https://apers.app/learn/asset-classes/office/office-underwriting-ti-lc-free-rent-effective-rent
- NextGen Properties, “Tenant Improvement Allowances for Commercial Landlords” (TI benchmarks by class) — https://blog.nextgenproperties.com/development/tenant-improvement-allowances-commercial-leases-landlords/
- Justin Crow CRE, “Tenant Improvement Allowance in South Florida (2026 Guide)” — https://justincrowcre.com/blog/tenant-improvement-allowance-south-florida/
- Florida Statutes, s. 166.04151 and s. 125.01055 (Live Local Act zoning preemption) — Online Sunshine, leg.state.fl.us
About the Author