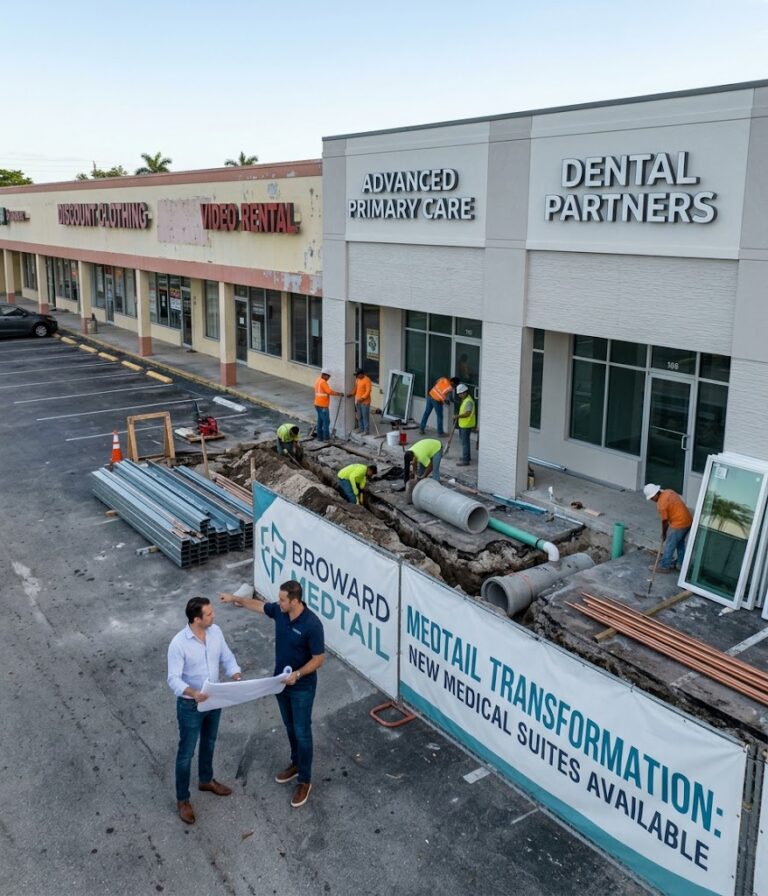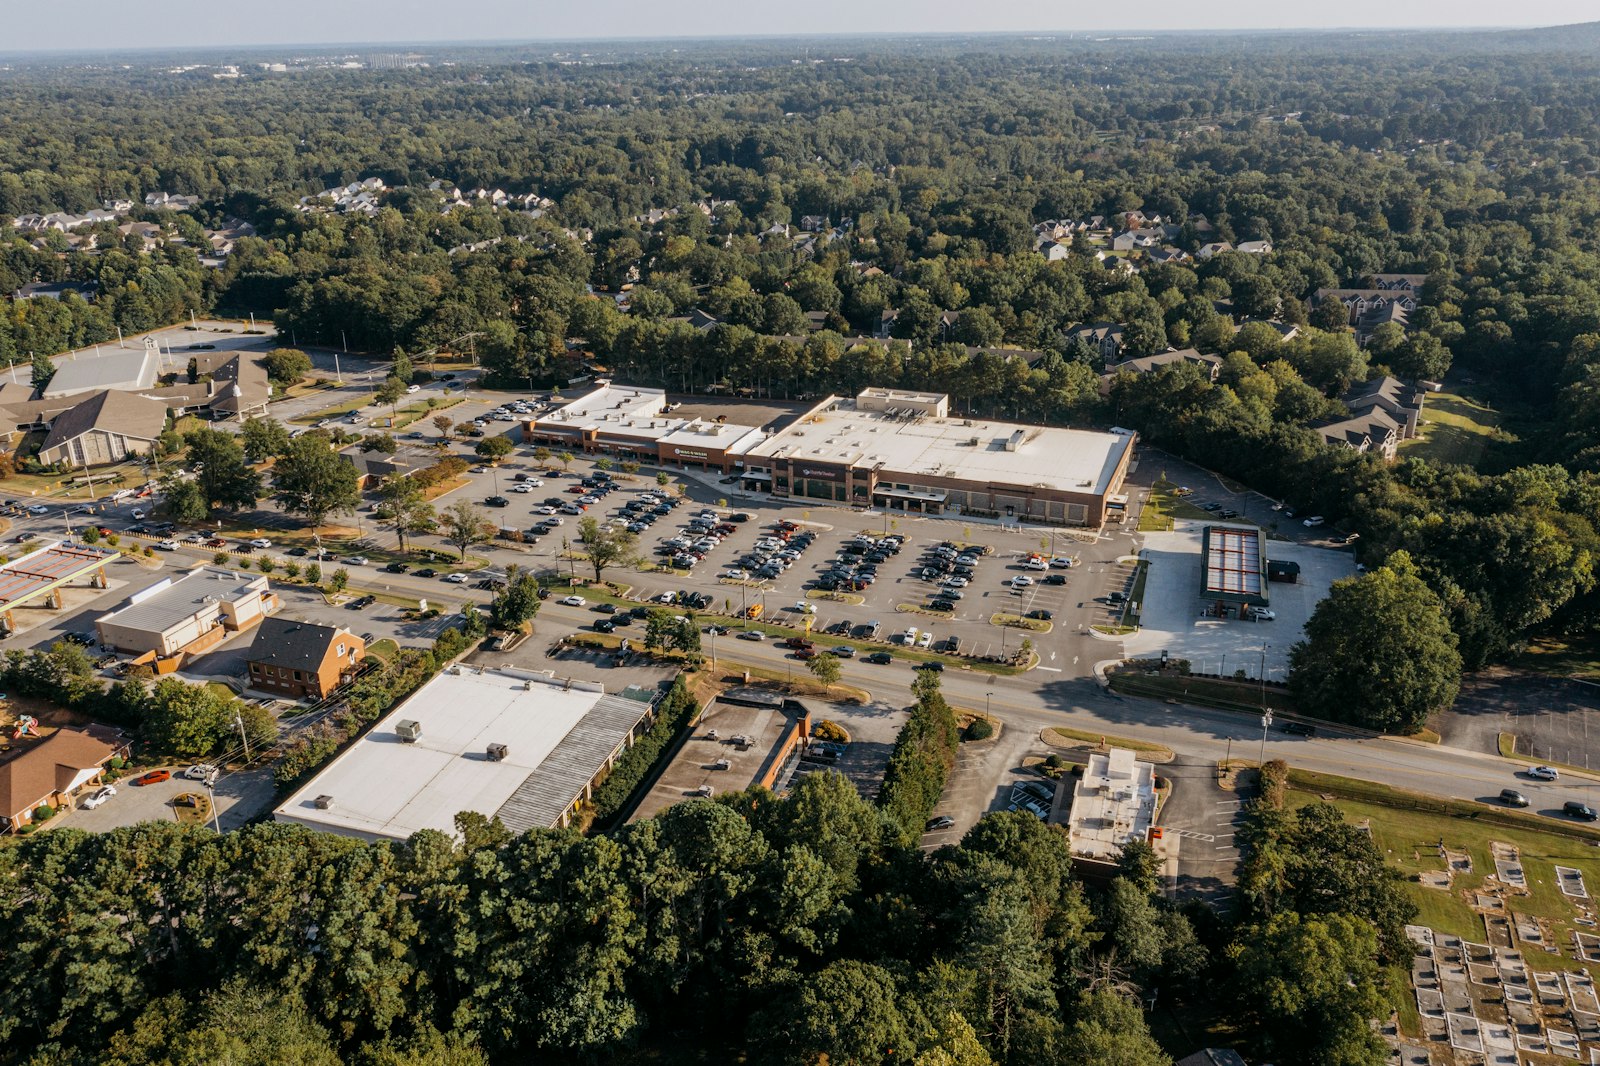
Aerial view of a suburban grocery-anchored shopping center in Greer, South Carolina. Photo: Alex Reynolds via Unsplash, Unsplash License.
Quick Answer: Jacksonville-based Regency Centers, a grocery-anchored shopping center REIT, reported third-quarter 2026 Nareit FFO of $1.23 per share, up from $1.15, as same property NOI rose 5.1% and leased occupancy hit a record 97.0%. Regency raised its 2026 outlook and its quarterly dividend by 6% to $0.80, but commentary points to slower growth in 2027.
Regency Centers is a self-administered real estate investment trust, an S&P 500 member headquartered in Jacksonville, that owns and develops grocery-anchored shopping centers. Its centers are typically built around a supermarket and filled with smaller shops, restaurants and service tenants such as salons, banks and medical offices. Grocery anchors draw frequent, needs-based visits, which supports traffic for the smaller tenants around them.
Regency released its third-quarter 2026 results on November 5. The report showed record occupancy, strong rent growth on new and renewal leases, a growing development pipeline and a dividend increase. It also included a large impairment charge that cut GAAP earnings, and analysts pointed to a slower 2027. This analysis covers the results and what they say about the shopping center market.
What did Regency report for the third quarter of 2026?
Nareit funds from operations, the standard earnings measure for real estate investment trusts, was $230.8 million, or $1.23 per diluted share, up from $213.5 million, or $1.15, a year earlier. Core Operating Earnings, a measure Regency uses that excludes certain non-cash and non-recurring items, rose about 8% to $1.18 per share from $1.09.
GAAP net income attributable to common shareholders fell to $75.1 million, or $0.41 per share, from $106.0 million, or $0.58. The decline was caused by a $65.1 million impairment charge, equal to $0.35 per share, partly offset by $23.8 million of gains on property sales. Impairments are excluded from FFO, which is why FFO rose while GAAP earnings fell.
President and Chief Executive Officer Lisa Palmer said, “Regency delivered strong third quarter results,” adding that the performance “enabled us to once again raise our full-year outlook and increase our common stock dividend.”
Regency Centers Q3 2026 at a glance
| Metric | Q3 2026 | Q3 2025 | Change |
|---|---|---|---|
| Nareit FFO | $230.8M | $213.5M | +8.1% |
| Nareit FFO per share | $1.23 | $1.15 | +7.0% |
| Core Operating Earnings per share | $1.18 | $1.09 | +8.3% |
| Net income per share | $0.41 | $0.58 | -29% |
| AFFO | $193.6M | $176.5M | +9.7% |
| Same property NOI growth | +5.1% | n/a | n/a |
| Same property percent leased | 97.0% | 96.4% | +60 bp |
| Quarterly dividend | $0.80 | n/a | +6% |
Source: Regency Centers Q3 2026 earnings release, November 5, 2026.
According to Finviz, revenue was $419.1 million, up 8.1% from a year earlier and about 1.8% ahead of consensus. FFO of $1.23 beat the $1.22 consensus by a penny but was a penny short of the $1.24 Earnings Whisper number.
How are Regency’s properties performing?
Same property net operating income, which compares the same set of centers year over year, grew 5.1% to $289.1 million from $275.2 million. Excluding redevelopments, growth was 3.5%. Base rent contributed 4.0 percentage points of the growth. For the first nine months, same property NOI rose 4.4%.
Operating efficiency improved. Regency recovered 87.5% of its operating expenses from tenants in the quarter, up from 85.7%, and its NOI margin was 69.8%. Total NOI, including properties not in the same-store pool, rose 7.6% to $303.2 million.
The expense recovery ratio matters because shopping center leases typically pass property taxes, insurance and common-area maintenance costs through to tenants. A higher recovery ratio means Regency is passing more of those rising costs to tenants rather than absorbing them, which protects its margins when operating costs such as insurance and taxes rise. The 1.8-point improvement in the recovery ratio, combined with higher base rent, explains much of the 5.1% same property NOI growth.
Occupancy is at record levels. Same property centers were 97.0% leased, up 60 basis points from a year earlier. Anchor spaces of 10,000 square feet or more were 98.5% leased, and smaller shop spaces were 94.6% leased, a record according to Finviz, up from 94.2% at the end of 2025. Commenced occupancy, which counts only tenants that are open and paying rent, rose to a record 95.1%.
Regency same property occupancy, September 30, 2026
| Measure | Rate | Change |
|---|---|---|
| Percent leased, total | 97.0% | +60 bp year over year |
| Percent leased, anchor (10,000+ sq. ft.) | 98.5% | +10 bp vs. prior quarter |
| Percent leased, shop (under 10,000 sq. ft.) | 94.6% | +20 bp vs. prior quarter |
| Percent commenced, total | 95.1% | +80 bp year over year |
| Signed-not-opened gap | About 1.9 points | Leased minus commenced |
Source: Regency Q3 2026 release. Gap calculated.
The gap between leased and commenced occupancy, about 1.9 percentage points, represents tenants that have signed leases but have not yet opened. As those tenants move in and start paying rent, they add to future income without requiring new leasing.
How fast are shopping center rents rising?
Rent growth on new and renewal leases remains strong. Regency signed about 1.7 million square feet of comparable leases in the third quarter at a blended cash rent spread of 11.9%, meaning new rents were nearly 12% higher than the prior rent for the same space. On a straight-line basis, which averages rent increases over the lease term, the spread was 21.8%.
Over the trailing 12 months, Regency signed about 7.0 million square feet of comparable leases with a blended cash spread of 11.5% and a straight-line spread of 22.4%. Finviz reported renewal cash spreads of 15%, up from 13%, and tenant retention of 84%. It also noted that straight-line rent spreads of 22% were below the record 25% reached at the end of 2025.
High rent spreads combined with high retention indicate that most tenants are renewing even at sharply higher rents, which may reflect limited alternative space in Regency’s trade areas. It also means Regency’s existing leases are still below market, leaving room for further rent growth as leases expire.
Regency leasing activity
| Measure | Q3 2026 | Trailing 12 months |
|---|---|---|
| Comparable leases signed | About 1.7M sq. ft. | About 7.0M sq. ft. |
| Blended cash rent spread | +11.9% | +11.5% |
| Blended straight-line rent spread | +21.8% | +22.4% |
What is Regency building?
Regency’s in-process development and redevelopment projects total $682 million of estimated net costs at its share, of which 46% has been spent, at a blended estimated yield of about 9%. It started about $101 million of projects in the third quarter and about $241 million year to date, and completed one ground-up project of about $96 million.
Third-quarter starts included Redlands Marketplace, a $46 million Whole Foods-anchored center in the Los Angeles area, and The Shops at Fall Hill, a $24 million specialty grocer-anchored center in Fredericksburg, Virginia. After the quarter, Regency started Poppy Ranch at Morgan Hill, a $42 million Sprouts-anchored project in California.
A 9% yield on new development compares with a 6.3% average cap rate on Regency’s acquisitions so far this year, which is why developing new centers can create more value than buying existing ones, based on those figures.
Development is accelerating. Finviz reported that Regency expects about $400 million of development starts in 2026, compared with more than $300 million in 2025 and about $250 million in 2024.
Regency development activity
| Measure | Figure |
|---|---|
| In-process projects (Regency share) | $682 million |
| Share of costs incurred | 46% |
| Blended estimated yield | About 9% |
| Q3 2026 starts | About $101 million |
| Year-to-date starts | About $241 million |
| Expected 2026 starts | About $400 million |
| 2025 starts / 2024 starts | More than $300 million / about $250 million |
Sources: Regency Q3 2026 release; Finviz.
What is Regency buying?
Year-to-date acquisitions totaled $66.8 million at Regency’s share, at a 6.3% weighted-average cap rate. Recent purchases include Franklin Crossing, an 88,000-square-foot Stop & Shop-anchored center in Franklin Lakes, New Jersey, for $27 million; Cornerstone at Westford, a 236,000-square-foot Market Basket-anchored center near Boston, bought through a joint venture for $74 million in total; and Hanover Village, a 90,000-square-foot Aldi-anchored center near Richmond, Virginia, for about $14 million. Dispositions year to date were just $4.6 million, at a 6.2% cap rate. Finviz put total acquisitions above $170 million year to date, a figure that appears to include joint venture partners’ shares, compared with Regency’s own $66.8 million share.
Regency raised its full-year acquisition estimate to about $80 million from about $70 million at its share, with the expected cap rate rising slightly to about 6.4%. The buying has focused on centers anchored by grocers such as Stop & Shop, Market Basket and Aldi in the Northeast and Mid-Atlantic.
How strong is Regency’s balance sheet?
Regency’s leverage is moderate for a REIT. Net debt and preferred stock were 4.9 times trailing 12-month operating EBITDAre at September 30, and it had about $1.4 billion of available revolving credit capacity.
The board raised the quarterly common dividend 6% to $0.80 per share, payable January 5, 2027, to shareholders of record on December 14, 2026. On an annualized basis, that is $3.20 per share. The increase follows growth in AFFO, the cash flow measure from which REIT dividends are paid, to $193.6 million in the quarter.
What is Regency’s 2026 outlook?
Regency raised its 2026 Nareit FFO guidance to $4.86 to $4.88 per share from $4.84 to $4.88, and its Core Operating Earnings guidance to $4.65 to $4.67 from $4.62 to $4.66, which the company said implies about 5.7% growth at the midpoint. Same property NOI growth is now expected to be 4.25% or better, up from 3.7% to 4.1%. Because of the impairment, GAAP net income guidance fell to $2.31 to $2.33 per share from $2.48 to $2.52.
Regency 2026 guidance
| Measure | Prior | Updated |
|---|---|---|
| Nareit FFO per share | $4.84 to $4.88 | $4.86 to $4.88 |
| Core Operating Earnings per share | $4.62 to $4.66 | $4.65 to $4.67 |
| Same property NOI growth | +3.7% to +4.1% | +4.25% or better |
| Net income per share | $2.48 to $2.52 | $2.31 to $2.33 |
| Acquisitions | About $70M | About $80M |
| Development and redevelopment spend | About $350M | About $350M |
Source: Regency Q3 2026 release.
How did Regency perform over nine months?
Year to date, Nareit FFO was $681.4 million, or $3.64 per share, up from $3.46 a year earlier, and Core Operating Earnings were $654.9 million, or $3.50 per share, up from $3.29. AFFO rose to $576.5 million from $537.2 million. Net income attributable to common shareholders was $312.6 million, or $1.70 per share. Same property NOI grew 4.4% for the nine months, or 3.0% excluding redevelopments.
Regency nine-month results
| Measure | 9M 2026 | 9M 2025 |
|---|---|---|
| Nareit FFO per share | $3.64 | $3.46 |
| Core Operating Earnings per share | $3.50 | $3.29 |
| AFFO | $576.5M | $537.2M |
| Same property NOI growth | +4.4% | n/a |
What does 2027 look like?
Regency’s release did not include 2027 guidance, but the Earnings Whispers analysis on Finviz summarized expectations that growth will slow. Same property NOI growth is expected to ease to roughly the mid-3% range. Gains in commenced occupancy are expected to shrink to about 40 to 50 basis points because the portfolio is already nearly full. Bad debt is expected to normalize to about 50 basis points from about 25, and the drag from refinancing debt at higher rates is expected to widen to 150 to 200 basis points of earnings growth, from 100 to 150 this year.
Other headwinds cited include volatile interest rates affecting acquisitions, Albertsons reviewing its real estate, and new development yields of about 7% to 8%, below the roughly 9% on the current pipeline. Regency shares were at $76.28 ahead of the report, according to Finviz, and the author read the stock’s recent weakness as the market pricing in the 2027 slowdown.
Brian’s Take
Regency is a good example of why grocery-anchored retail has held up so well. Ninety-seven percent leased, shop space at a record 94.6%, and new leases signing nearly 12% above the old rent. Those are landlord’s-market numbers.
The part I’d watch is the math for next year. When a center is already 97% leased, there is not much occupancy left to gain, so growth has to come from rent increases and new development. Refinancing older, cheaper debt at today’s rates will also take a bigger bite.
For a Jacksonville company, though, Regency is in a strong position: moderate leverage at 4.9 times, about $1.4 billion of available credit, a growing development pipeline at a 9% yield and a 6% dividend increase.
Frequently Asked Questions
Where is Regency Centers headquartered?
Regency Centers is headquartered in Jacksonville, Florida.
What were Regency’s Q3 2026 results?
Nareit FFO was $1.23 per share, up from $1.15, and same property NOI grew 5.1%.
How full are Regency’s shopping centers?
Same property centers were a record 97.0% leased, with shop space 94.6% leased.
Why did Regency’s net income fall?
A $65.1 million impairment charge, or $0.35 per share, reduced GAAP net income. It is excluded from FFO.
How much is Regency’s dividend?
Regency raised its quarterly dividend 6% to $0.80 per share, payable January 5, 2027.
Is Regency’s growth expected to slow in 2027?
Analyst commentary points to same property NOI growth easing to the mid-3% range in 2027, as occupancy gains shrink and refinancing costs rise.
Sources and Further Reading
- Regency Centers Corporation, Third Quarter 2026 Results, Form 8-K Exhibit 99.1, November 5, 2026 – U.S. Securities and Exchange Commission
- Finviz / Earnings Whispers, “Regency Centers Lands a Cent Short of the Whisper as Record Occupancy Lifts 2026 but a Slower 2027 Comes Into View,” November 2026
About the Author